

Detected. Explained. Prioritized.
Acuity AI turns operational and financial signals into a ranked list of what needs attention now, with a recommended action for each item.
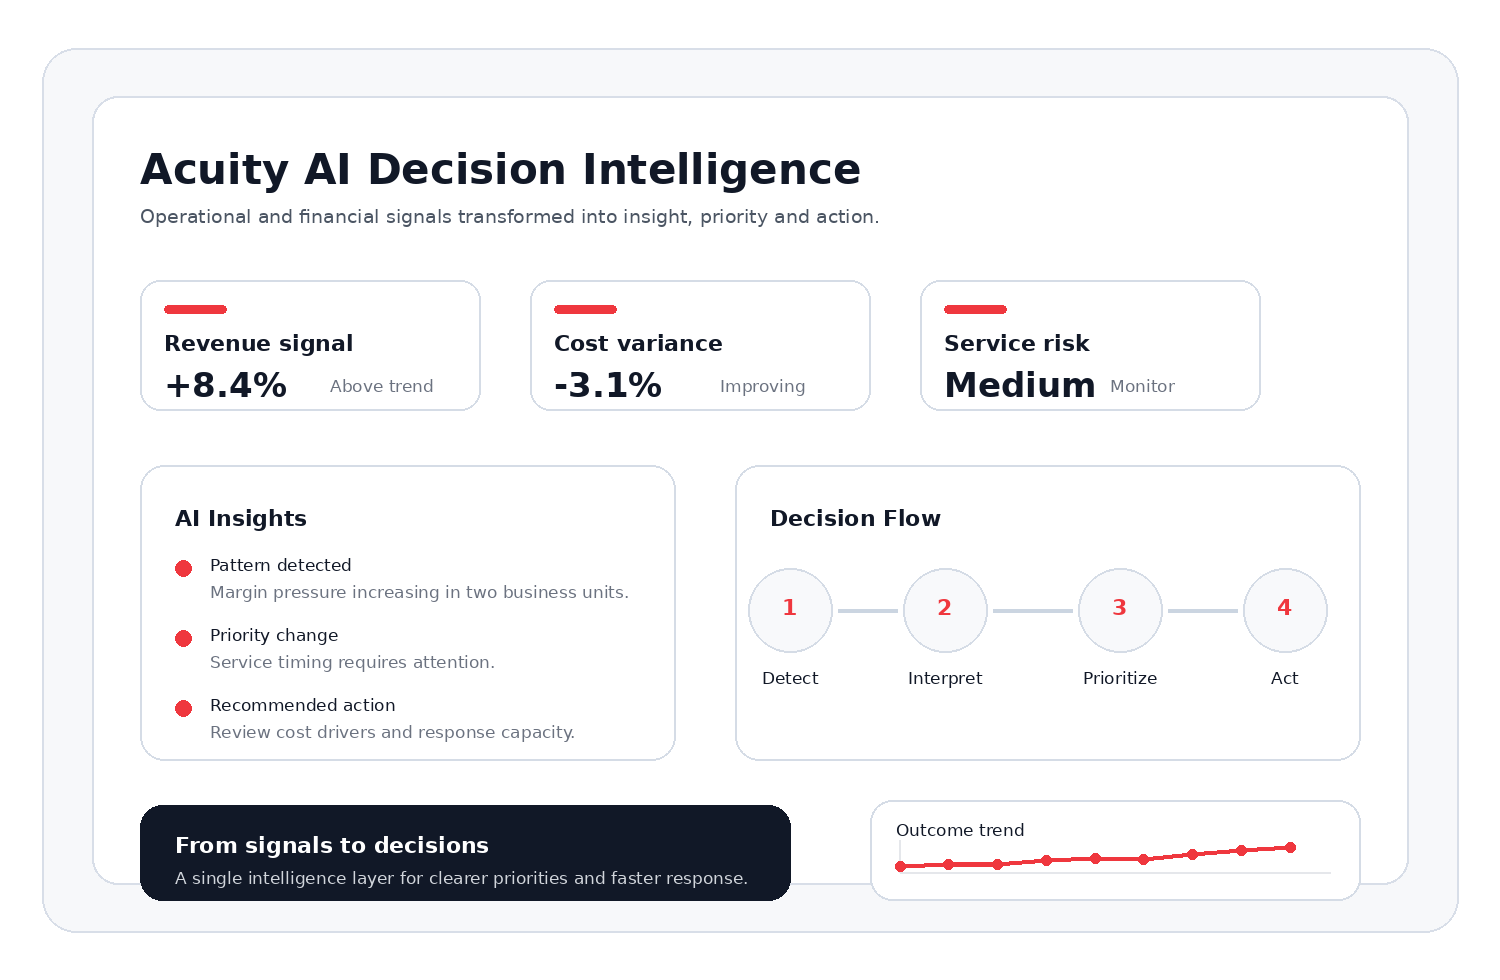
Most performance problems are visible in operational data weeks before they appear in the financials.
Acuity AI identifies these signals while there is still time to act and tells the team which items to address first, in priority order.
It sits between the existing dashboards and the day-to-day management decisions, identifying which items require attention, the likely drivers, and the recommended next step.
Three functions in one platform.
Continuous scanning of operational and financial signals.
Acuity AI scans operational and financial data continuously, identifies the signals that warrant attention, and flags them at the point they appear, distinguishing real performance shifts from normal variance. Each alert includes the supporting context required to act on it.
How detection works →
A ranked list of items requiring attention each day.
The team receives the five to ten items that require attention, ranked by estimated financial impact. Acuity AI identifies the likely drivers and recommends an order of investigation.
See the workflow →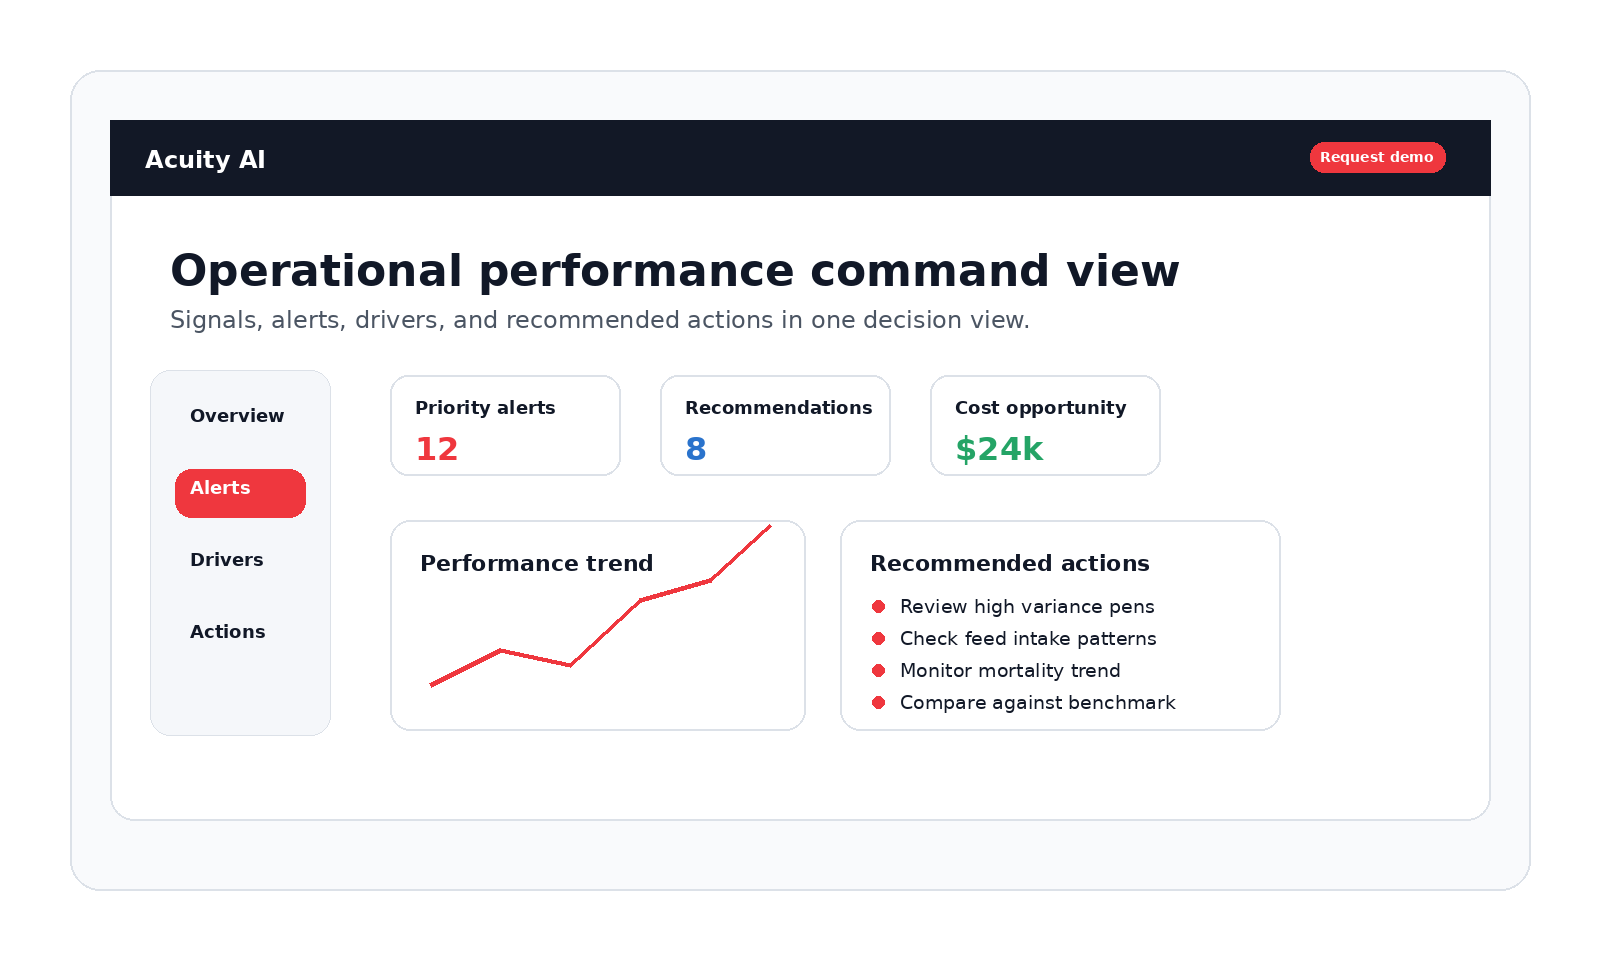
Standardized comparison across sites, branches, or portfolios.
For operations that run across multiple locations such as branches, sites, or business units, Acuity AI standardizes the comparison and identifies which units lead, which lag, and the operational differences between them.
Explore use cases →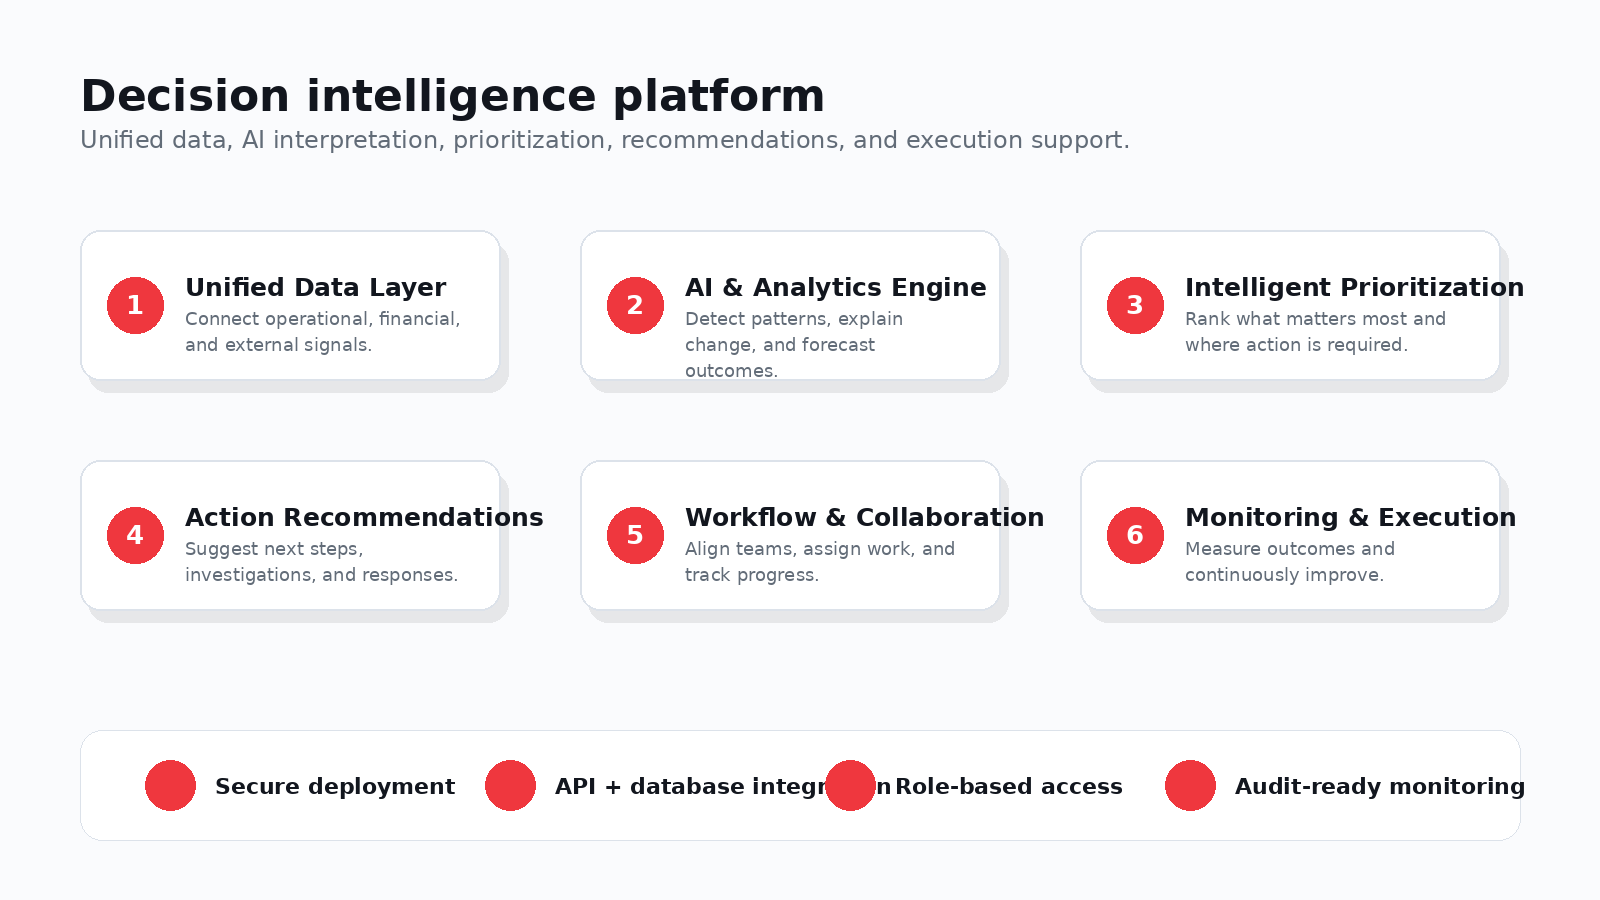
Operational outcomes.
Early detection of performance drift.
Operational data carries signals of performance problems weeks before they appear in the financials. Acuity AI surfaces these signals while there is still time to act on them within the same period.
A single daily priority list.
Acuity AI works on top of existing BI tools and reports, producing a ranked daily list of items that require management attention.
Comparison across units.
For multi-site or multi-unit operations, Acuity AI identifies which units lead, which lag, and the operational factors that account for the difference.
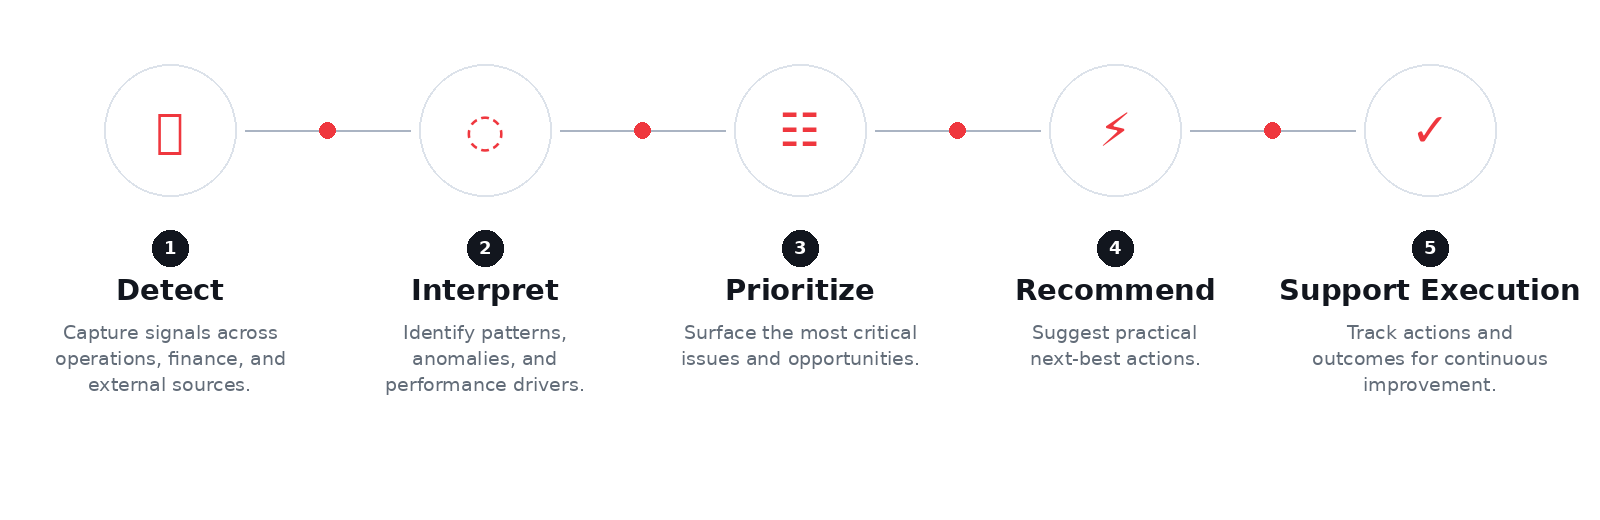
Detect. Interpret. Prioritize. Act.
A single decision system that converts operational signals into the ranked daily priority list the team works from.
Request a walkthrough of the platform.
A 20-minute walkthrough focused on the workflow the team runs. No setup or commitment required.
Or read the platform overview to review the architecture first.